
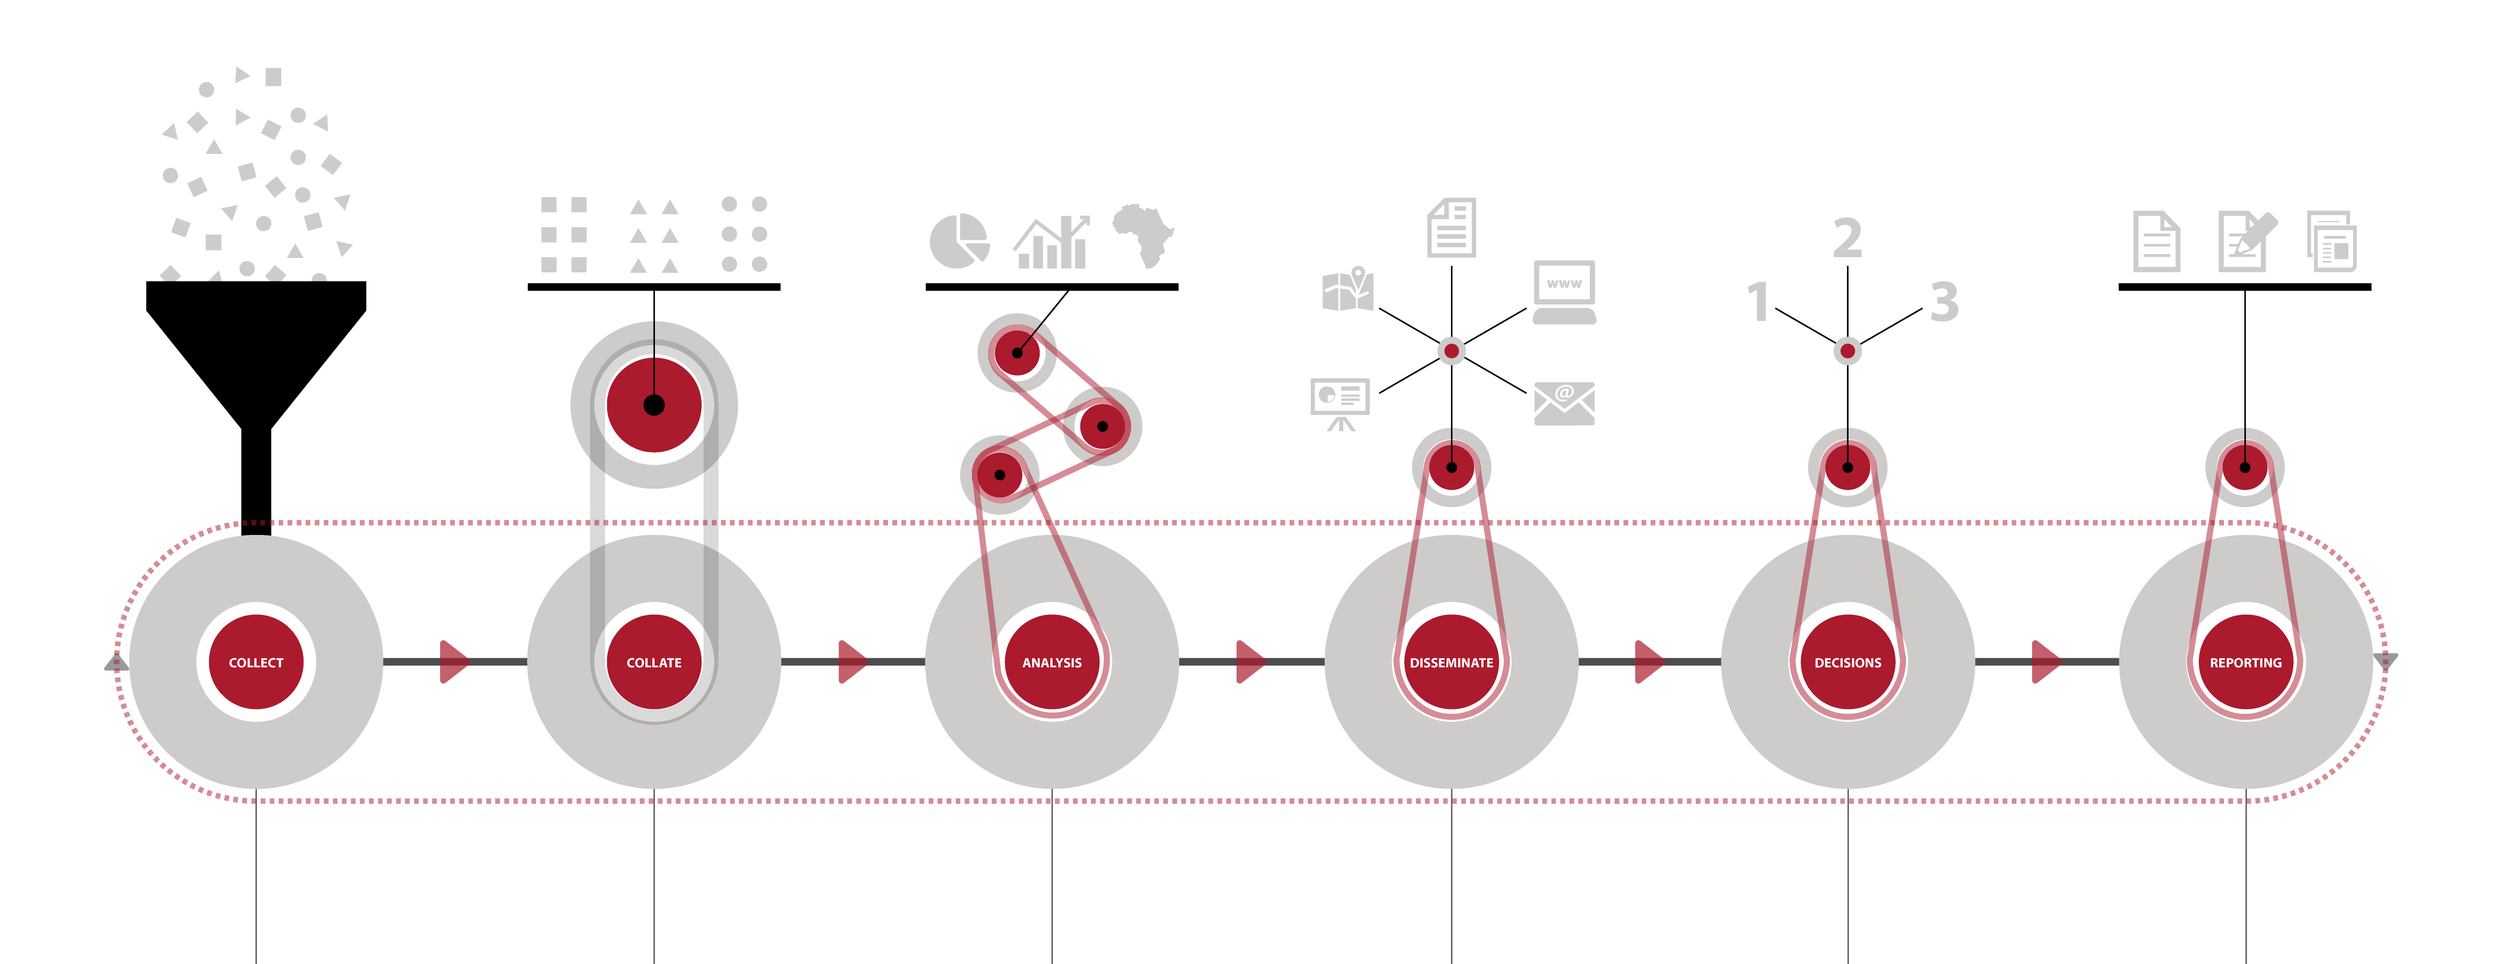
From Info-process to Product
VISUAL DATA CENTER AT AMERICAN RED CROSS

On info-storytelling.
As our digital information becomes increasingly crafted, delivered, and consumed with journalistic curiosity, everyone should have access to open and easily digested data platforms — info-consumption is social, as indeed is info-storytelling.
At American Red Cross, real-time data gathering/analysis and rapid data visualization have become one of the core practices in response to disaster relief. The ongoing mission always strives for efficient and effective info-storytelling.
GIS Visual Data Center
CLIENT / AMERICAN RED CROSS
This project was initiated at the Geographic Information System (GIS) department at American Red Cross to develop an overarching structure and product for users to better access information. GIS Visual Data Center was a product developed along with a system of iconography and visualization of task processes and structure at the organization.


Social & interactive experience.
GIS VISUAL DATA CENTER
Tap, drag, swipe, pinch… through these touch gestures, users are able to dive into layers of information, explore more facts within complex data, and share more knowledge with others.


My philosophy.
The viable data within a piece of information design should guide the user intuitively.

The Sustainable data.
The sustainable practice of information design means to deliver data simple enough to cater the general public, complex enough for in-depth analysis, more importantly, suitable to share and become part of our social knowledge.